2021 Ricardo Water Markets Report
Background
Australian water management has undergone a significant period of reform over the past three decades. The establishment of water markets has been a key component of this reform story.
Water markets are now an established part of agricultural, urban and environmental water policy, management and investment in Australia.
The Ricardo Water Markets Report provides an overview of current water market activity in the southern Murray–Darling Basin, compares market outcomes with recent years and comments on the future outlook.
>> Click here to download the PDF version
>> Explore other Ricardo Water Markets Reports here
About Ricardo
Our Water Market Services
We are a team of award-winning, independent water markets, policy, and infrastructure advisors.
Every day, we help businesses and governments make better decisions about scarce water resources.
We do this by providing high-quality information, insights and analysis that help our clients design and implement strategies for successfully participating in Australia’s water markets. Our team also provides policy, regulatory and infrastructure advisory services.
Whether you need custom-designed water strategies or assessments of your exposure to water-related risks and opportunities, we’ll help you make clear, informed and confident water decisions.

Chris Olszak, Director
Executive Summary
Facts at a glance – 2020-21
- Estimated value of commercial allocation trade in major southern MDB trading zones: $189 million.
- Annual average southern MDB allocation prices: $95 per ML in NSW Murray (above Barmah) to $191 per ML in SA Murray.
- Estimated value of major southern MDB entitlements on issue (including environmental and Victorian water corporation holdings): $26.5 billion.
- Ricardo Entitlement Index (AEI) 30 June 2021: 251 points (up 6 per cent over 12 months).
- Value of total entitlement transfers: $744 million.
- Total volume of entitlement transfers or trades (outside of irrigation corporations): 239 GL (down 7 per cent on 2019-20).
- Entitlement market turnover: 4 per cent.
- Average annual high security and high reliability entitlement returns (sale of allocations): between 1 and 3 per cent.
Summary of 2020-21
2020-21 will be remembered as the first wet year after the driest 36 months on record for the southern Murray-Darling Basin (MDB). Regular rainfall and lower allocation prices than the last two water years brought welcome relief for irrigators across the Basin.
Allocation markets
- Large areas of the MDB received above average rainfall most months between July 2020 and March 2021. Regular rainfall and good inflows into storages improved water supply conditions in all systems across the southern MDB compared to the last three water years.
- Average water allocation prices started the water year just above $300 per ML, and then tumbled throughout the year as allocations to entitlements increased and timely in-crop rainfall arrived.
- Binding trade constraints in the first half of the season created price differentials between upstream zones and the lower Murray again. But, with increased water supply in all zones, the differentials were not as large as in 2019-20 (in absolute terms).
- The combination of high volumes of carryover from 2019-20, improved water availability in 2020-21, and water usage below budget for many permanent horticulturalists created the second largest volume of carryover in all major trading zones.
Entitlement markets
- Prices for high reliability and high security entitlements generally stabilised in 2020-21 after the price decreases between January and June 2020. This price stabilisation was likely underpinned by the strength of the Australian agricultural sector, and the long-term expectations of market participants.
- Market activity for low reliability and general security entitlements was again influenced by demand for carryover space. Increased returns from improved allocations to NSW general security entitlements also revived entitlement market activity.
- The 2020-21 price increases in low reliability and general security entitlements were the primary driver of the return to month-on-month increases in the Ricardo Entitlement Index between January and June 2021.
Facts at a glance – Outlook
- Comparison of 2020-21 and 2021-22 opening season allocations to consumptive users (excluding carryover): 600 GL more water allocated at opening of 2020-21.
- Estimated 2021-22 total volume of water available to southern MDB consumptive users before peak irrigation season under average inflows scenario (including carryover): approximately 5,300 GL.
- Bureau of Meteorology three-month rainfall outlook (August to October) for southern MDB: Above average.
- Current (early August 2021) southern MDB allocation prices: $65 to $120 per ML.
Outlook for 2020-21
At the start of 2021-22, the large volumes of carryover and favourable outlook for spring rain mean that many irrigation businesses are set for a successful year. Annual croppers will be gearing up for a big season and hoping that further inflows extend the good times for another year or two.
Allocation markets
- Quick increases in allocations to most entitlements in the southern MDB in the first six weeks of the water year mean many market participants can afford to be patient. As a result, allocation markets have generally been quiet.
- If average inflows eventuate from here (early August 2021), by peak irrigation season, consumptive water availability could be higher than the volume available by mid-December in 2020. If this happens, allocation prices could settle around or below prices seen in the final months of 2020-21. It will likely take a marked return to drier conditions to push prices up from current levels this water year, although the key driver to watch will be buying demand from annual croppers as summer approaches.
- With downstream trade opportunities closed, prices will be higher in the lower Murray than the upstream zones. But the 2021-22 price differentials will likely be relatively small in absolute terms because of the increased water availability in all zones.
- The key dynamics to watch are: (1) If irrigators need to draw on their carryover from 2020-21. With increased allocations to entitlements, and positive rainfall outlooks, conditions are set for there to be another year of high volumes of carryover which will mean many irrigators will be well placed entering 2022-23. (2) The timing of in-crop rainfall and summer temperatures. With large areas of winter crops planted, and promising rainfall and allocation outlooks likely to encourage summer crop planting, 2021-22 could be a high water usage year. Depending on how these factors combine, the drawdown on storages could be much larger than the last two water years. If it stays wet, then the good times will continue for another year.
Entitlement markets
- The long-term outlook for entitlement markets remains strong. However, compared to last year, key uncertainties that may have been creating caution among water market participants have eased.
- High reliability and high security entitlement prices seem to have stabilised, possibly reaching a new equilibrium after five years of rapid appreciation.
- Against the backdrop of firming commodity prices, low interest rates and a positive outlook for the Australian agricultural sector, there seems to be limited supply of high reliability and high security entitlements coming to market. If this continues, prices for these entitlements may start to increase.
- Demand for carryover space will likely continue to be a feature of water markets in the southern MDB. Many permanent horticulturalists still have immature plantings, and will continue to look for secure carryover space to cover their water needs. With limited supply of carryover space in the lower Murray, demand for all low reliability entitlements will likely continue.
- 2021-22 is likely to be a strong year for NSW general security entitlement values. Current allocations are already better than they were at the same time during the last three water years. This will support improved returns for general security entitlement holders.
1.0. Introduction
1.1. Introduction
Now in its eighth year, the Ricardo Water Markets Report provides water market participants, advisors, investors, and policy professionals with an annual snapshot of recent water market drivers and activity in the southern Murray-Darling Basin (MDB) (Figure 1).
This year’s report highlights the key drivers of the lower water allocation prices observed in 2020-21 compared to the last three years, including:
- the 2020-21 La Niña event and increased allocations to general security entitlements.
- cooler summer conditions that meant many permanent horticulturalists’ water use was below budget.
- high volumes of carryover from 2019-20 that suppressed buying demand throughout the year.
We also draw attention to how low allocation prices and, therefore, lower returns for entitlement holders have not materially influenced high reliability and high security entitlement prices. After entitlement prices declined in early 2020, high reliability and high security entitlement prices generally stabilised in 2020-21. This stabilisation potentially indicates a maturing of the market and the long-term expectations of market participants.
As we look ahead from August 2021 (the time of writing), our outlook for 2021-22 explores how these factors may influence water markets in the southern MDB over the next 12 months.

Figure 1. Water trading zones in the southern Murray-Darling Basin.
Source: Ricardo, 2021.
Ricardo Entitlement Index
As the only index of its kind in Australia, the Ricardo Entitlement Index (AEI) provides a simple and reliable snapshot of water entitlement performance throughout the southern MDB.
Across the 2020-21 water year, the AEI increased by 6 per cent; the same percentage increase as in 2019-20. The AEI was relatively steady during the first six months of the water year (increasing 1.5 per cent). Then from December 2020 the AEI increased more than 4 per cent (Figure 2).
The Ricardo Entitlement Index tracks the performance (capital value) of a group of major water entitlements across the southern MDB.
Although the AEI has recovered most of the decline that took place in the second half of the 2019-20 water year, increases to low reliability and general security entitlement prices have been the primary driver of the return to an upwards trend. The AEI is currently 1 per cent below its all-time high set in January 2020. The Compound Annual Growth Rate of the AEI is 7 per cent since its inception in 2008.
Ricardo’s independent water market specialists update the AEI every month using our in-house southern Murray-Darling Basin water asset valuations. The AEI supports better decision making by providing irrigators, investors, banks and other water owners with a reliable benchmark to track the capital value performance of water portfolios and investments and attract new investors.

Figure 2. Ricardo Entitlement Index, 2008-09 to 2020-21.
Source: Ricardo, 2021.
2.0. Market Conditions
2.1. Climatic Conditions
Rainfall a welcome relief after the driest 36 months on record.
2020-21 will be remembered as the first wet year after the driest 36 months on record for the MDB (Bureau of Meteorology, 2020).
Wetter conditions across the MDB were driven by a moderate strength La Niña event. This meant that large areas of the MDB received above average rainfall most months between July 2020 and March 2021 (Figure 3).
La Niña also brought cooler temperatures. The 2020-21 summer was the coolest since 2011-12 in NSW and the coolest since 2004-05 in Victoria (Bureau of Meteorology, 2021a, 2021b). Increased rainfall and cooler temperatures meant many permanent horticulturalists’ water use was well down on water budgets.
Although 2020-21 was considerably wetter than the three previous water years, rainfall varied across the MDB, especially across the headwater catchments in the southern connected system. The headwater catchments of the Murrumbidgee received very much above average rainfall for the year. For example, Bowning, near Lake Burrinjuck, recorded the highest monthly total on record in August 2020 (181mm). Rain also came early in the season for the Murrumbidgee.
In contrast, the Victorian headwaters of the Murray and Goulburn systems received below average to average rainfall for the year. This rainfall variability heavily influenced differences in the timing of allocations to entitlements across the southern MDB.

Figure 3. Rainfall deciles for the Murray-Darling Basin, 1 July 2020 to 30 June 2021.
Source: Ricardo 2021. Based on Bureau of Meteorology, 2021.
2.2 Storages
2020-21 ends with the highest volume held in southern MDB storages since 2016-17.
After rainfall in early 2020 wet the catchments, good runoff meant that southern MDB storages began to replenish. At the start of the 2020-21 water year there was approximately 680 GL more water held in southern MDB storages compared to at the start of 2019-20.
The storages continued to fill, finally breaking the three-year trend of decreasing peak volumes. In 2020-21, water held in southern MDB storages peaked at 9,470 GL, 47 per cent higher than in 2019-20 (Figure 4).
Although the peak volume in 2020-21 did not exceed the peak volumes of 2016-17 and 2017-18, the drawdown was low for the second year in a row. Net drawdown in the irrigation season was less than 2,000 GL (Figure 4). The low annual net drawdown was driven by mild summer temperatures and timely in-crop rainfall. The influence of these factors can be seen by the two interruptions to the drawdown when storages briefly started to fill again (Figure 4).
The good inflows and low demand meant that the volume held in southern MDB storages on 30 June 2021 (8,800 GL) was the largest volume held at the end of a water year since 2016-17. However, the differences across the catchments were stark. On the 30 June 2021:
- Murray storages were 63 per cent full (1,100 GL more than 1 July 2020).
- Lake Eildon was 60 per cent full (320 GL more than 1 July 2020).
- Murrumbidgee storages were 97 per cent full (1,170 GL more than 1 July 2020).

Figure 4. Volume held in storage, southern Murray-Darling Basin major headwater storages, 2016-17 to 2020-21.
Source: Ricardo 2021. Based on Bureau of Meteorology, 2021.
2.3 Allocations
Largest total volume of water allocated to major southern MDB entitlements in four years.
The total volume of water allocated to all entitlements (including environmental water holdings) across the southern MDB in 2020-21 was the highest in four years. Total water allocations were approximately 6,100 GL, which is double the volume of water allocated in 2019 20 (approximately 3,000 GL) (Figure 5).
2020-21 allocations finally broke the three year trend of decreasing water allocations between 2016-17 and 2019-20. The last year when total water allocated exceeded 6,000 GL was 2016-17 (approximately 6,900 GL).
The main driver behind increased water availability from new season allocations was much improved allocations to NSW general security entitlements, particularly NSW Murrumbidgee GS (end-of-season allocation was 100 per cent). As a lower reliability product, general security entitlements only receive substantial allocations in wetter than average years.

Figure 5. Estimated total volume of water allocated to major water entitlements in the southern Murray-Darling Basin, 2007-08 to 2020-21.
Source: Ricardo 2021. Based on Victorian, New South Wales and South Australian water registers, 2021.
Note: Allocations to all entitlement categories are shown, including allocations to environmental water and Victorian water corporation holdings. Excludes carryover and distributions from irrigation corporations.
2020-21 allocations were higher than 2019-20, but timing of allocations varied across systems.
Allocations across the board were higher in 2020-21 than 2019-20. But, there was considerable variation in the timing of allocations across the three systems.
Murrumbidgee irrigators benefited from maximum allocations to Murrumbidgee HS and GS entitlements. This is the fifth time since the end of the Millennium drought that Murrumbidgee entitlements have received maximum allocations.
In the Murray system, it was a slightly different story. 2020-21 was marked by slowly increasing allocations to those entitlements that materially influence water availability in this system. NSW Murray HS received its full allocation on 1 July 2020 (97 per cent), highlighting the value of this entitlement. Although SA Murray HS only opened on 54 per cent, it increased quickly, reaching 100 per cent – well before the start of the irrigation season. However, allocations to Victorian Murray HRWS and NSW Murray GS started low and increased slowly through the water year. Notably, Victorian Murray HRWS did not reach 100 per cent until the end of the peak irrigation season. Alongside 2015-16, this is the latest this entitlement has reached 100 per cent since the end of the Millennium drought (allocations only reached 66 per cent in 2019-20.)
Allocations to Victorian Goulburn HRWS reached 100 per cent by mid-November, the fastest since 2016-17 (Figure 6).

Figure 6. Water allocation determinations made to major southern Murray-Darling Basin entitlements, 2019-20 and 2020-21.
Source: Ricardo 2021. Based on Victorian, New South Wales and South Australian water registers, 2021.
Left axis – Cumulative allocation determination (%)
Green – 2019-20 seasonal determination (%)
Blue – 2020-21 seasonal determination (%)
2.4 Cropping patterns
Crucial winter-spring rains return to annual cropping regions.
Wetter conditions in 2020-21 were reflected in on-farm rainfall throughout annual cropping regions in the southern MDB.
During the crucial winter-spring period, most cropping regions received above median monthly rainfall (Figure 7). These favourable conditions and high allocations to general security entitlements meant many annual croppers committed to much larger planting programs than the very small areas planted in 2019 20. In NSW, while the 45,000 ha planted to rice exceeded the five year average (36,000 ha in 2020-21) it was constrained by the large area of winter crops planted. In contrast, the 193,000 ha of cotton planted in NSW was well below the five year average of 238,000 ha (ABARES 2021a).
Summer was also wetter than average for most regions, particularly January and March (Berri and Mildura were exceptions). Sustained rainfall and improved soil moisture contributed to the NSW 2020-21 summer crop production increasing to around 1.8 million tonnes, compared to 2019 20, albeit off a very low base (ABARES 2021a).
Despite drier than average conditions in April and May, wet conditions returned in June (Figure 7) and soil moisture remained high. Rainfall outlooks for early 2021-22 are also promising. This means that annual croppers in NSW commenced similar sized winter crop planting programs to 2019 20. (ABARES 2021a).

Figure 7. Monthly observed and median rainfall in southern Murray-Darling Basin annual cropping regions, 2020-21.
Source: Ricardo 2021. Based on Bureau of Meteorology, 2021.
Note: Time period over which median rainfall is calculated varies by location. See Figure Notes.
Left axis – Monthly rainfall (mm)Green – Monthly rainfall median
Blue – 2020-21 rainfall
2.5 Demand for Water
Water use in Murrumbidgee returns to 2016-17 and 2017-18 levels.
Total water use in NSW and Victoria increased in 2020-21 by almost 63 per cent compared to 2019-20 (Figure 8). This reflects the wetter conditions and increased allocations to NSW general security entitlements.
Increased water usage was most apparent in the Murrumbidgee. Water use in this system in 2020-21 increased 260 per cent from the very low base in 2019-20 (392 GL in 2019-20 to 1,411 GL in 2020-21). Maximum allocations in this system meant that annual croppers could take advantage of the favourable growing conditions. 2020-21 water use in the Murrumbidgee returned to 2016-17 and 2017-18 levels.
2020-21 water use in the NSW Murray was 189 per cent higher than in 2019-20, reflecting higher general security allocations. Although 2020-21 end of season allocations to NSW Murray GS entitlements were almost the same as allocations in 2017-18, water use against these entitlements was half of the water use in 2017-18. To some extent this likely reflects cooler conditions and timely in crop rainfall. It may also reflect the timing of allocations in 2020-21 which came later than in 2017-18 and some annual croppers may have been cautious with planting.
In contrast, water use in the Victorian Murray only marginally increased (11 per cent) in 2020-21 compared to 2019-20. Although allocations to Victorian Murray HRWS were 34 per cent higher in 2020-21 than 2019-20, many permanent horticulturalists’ water use was lower than their water budgets due to the cooler summer conditions.

Figure 8.Water usage in the Murrumbidgee, Murray (Victoria and NSW only) and Goulburn systems, 2016-17 to 2020-21.
Source: Ricardo 2021. Based on Victorian and New South Wales water registers, 2021.
Note: Water usage in the NSW Murrumbidgee and Murray is based on usage against HS and GS entitlements only (consumptive and environment). Water usage in the Victorian Murray and Goulburn is based on all allocation accounts with regulated trading zone sources including water shares and bulk entitlements.
2.6 Implications for the Market
Low water allocation prices enabled annual plantings in 2020-21, but price effects of structural adjustment still apparent.
2020-21 water allocation prices continued the downwards trend that started from the middle of 2019 20. The annual volume weighted average price (VWAP) across major trading zones in the southern MDB was $132 per ML in 2020-21 (Figure 9).
This result demonstrates how some of the structural changes that are playing out across irrigated agricultural industries in the southern MDB are increasing long-term water allocation prices. Favourable commodity prices have incentivised the development and expansion of permanent horticulture plantings, particularly in the lower Murray. Permanent horticulturalists tend to have inflexible water demands and a higher willingness to pay than other irrigators. The annual VWAP in 2020-21 was only slightly lower that the annual VWAP in 2009-10 ($144 per ML). Yet in 2009-10, 64 per cent less water was allocated than in 2020-21.
However, annual price outcomes are influenced by water prices in the years immediately prior. This is where monthly VWAPs tell a more nuanced story.
Despite the differences in water allocated, the trends in monthly VWAPs are the same in both years. In July 2020, average allocation prices were around $320 per ML, and decreased to as low as $71 per ML in April 2021. This price trend was almost the same as 2009-10 ($350 per ML in July, $74 per ML in April). Crucially, though, 2020-21 allocation prices were close to $200 per ML by October. These prices and the increased allocations meant annual croppers were prepared to commit to larger planting programs than the year before.

Figure 9.Annual and monthly volume weighted average prices, and total water allocated to major entitlements in the southern Murray-Darling Basin, 2007-08 to 2020-21.
Source: Ricardo 2021. Based on Victorian, New South Wales and South Australian water registers, 2021.
3.0. Allocation Markets
3.1. Allocation Trade Prices
Water allocation prices tumble across all trading zones.
After three years of year-on-year price increases, annual water allocation prices finally decreased in 2020-21. Average prices in 2020-21 were between 56 per cent and 76 per cent lower than they were in 2018-19 (Table 1).
With a return to wet conditions across the southern MDB, 2020-21 annual volume weighted average prices (VWAPs) decreased by between 69 per cent and 84 per cent compared to last water year (Table 1). In historic terms, 2020-21 annual allocation prices returned to prices similar to those in 2017-18.
Like 2019-20, trade constraints were binding for most of the year. This meant that average annual prices continued to vary across trading zones in 2020-21.
While absolute price differentials between upstream and downstream zones were considerably lower than in 2019-20, in all cases they were higher than 2017-18. The exception was the Murrumbidgee. The price differentials between the Murrumbidgee and the lower Murray were the highest ever, between $58 and $95 per ML.
The estimated value of commercial allocation trade in major southern MDB trading zones was $189 million. This is considerably lower than the $538 million reported in 2019-20, but higher than the estimate of commercial allocation trade in 2017-18 ($139 million).
Table 1. Annual volume weighted average prices, major southern Murray-Darling Basin trading zones, 2018-19 to 2020-21.
|
Trading zone
|
VWAP 2018-19 ($/ML)
|
VWAP 2019-20 ($/ML)
|
VWAP 2020-21 ($/ML)
|
Change in price 2019-20 to 2020-21 (%)
|
Change in price 2018-19 to 2020-21 (%)
|
|---|---|---|---|---|---|
|
Vic 1A Greater Goulburn
|
$374
|
$511
|
$116
|
-77%
|
-69%
|
|
Vic 6 Murray (Dart to Barmah)
|
$415
|
$499
|
$129
|
-74%
|
-69%
|
|
Vic 7 Murray (Barmah to SA)
|
$463
|
$644
|
$160
|
-75%
|
-65%
|
|
NSW Murray (above Barmah)
|
$378
|
$304
|
$95
|
-69%
|
-75%
|
|
NSW Murray (below Barmah)
|
$427
|
$622
|
$154
|
-75%
|
-64%
|
|
NSW Murrumbidgee
|
$404
|
$586
|
$96
|
-84%
|
-76%
|
|
SA Murray
|
$431
|
$629
|
$191
|
-70%
|
-56%
|
3.2 Comparison of Allocation Trade Prices
Allocation prices decline and then plateau, closing below $100 per ML.
Water allocation prices in all trading zones were the highest for the year in the opening months of 2020-21. Then a combination of factors, including increased allocations to all entitlements, timely in-crop rainfall, and high volumes of carryover from 2019-20, continually placed downwards pressure on allocation prices (Figure 10).
The lowest weekly VWAPs for each trading zone were:
- Combined Goulburn $77 per ML (early April).
- Murray above Choke $75 per ML (late April).
- Murray below Choke $76 per ML (early April).
- Murrumbidgee $42 per ML (late March).
These weekly VWAPs reflect price decreases of between 69 and 86 per cent compared to early season prices.
Allocation prices in the Murrumbidgee decreased quickly early in the season and remained lower than all other zones for most of the year. This reflected the high early season allocations to Murrumbidgee entitlements. Prices in other zones decreased more gradually.
As trade constraints started to open in the second half of the year, prices began to equalise around $80 to $100 per ML across the Murray and Goulburn, and remained at these levels until the end of the year. Once trade into and out of the Murrumbidgee closed on 31 May, prices in the Murrumbidgee fell quickly, with prices below $40 per ML by the end of the season.

Figure 10.Weekly volume weighted average prices, major southern Murray-Darling Basin trading zones, 2020-21.
Source: Ricardo, 2021. Based on Victorian, New South Wales, and South Australian water registers, 2021.

Figure 11. Weekly transfer and trade volumes (within and into), major southern Murray-Darling Basin trading zones, 2020-21.
Source: Ricardo, 2021. Based on Victorian, New South Wales, and South Australian water registers, 2021.
3.3 Allocation Trade Activity
Limits on Goulburn to Murray trade return the Goulburn to a net importer of water.
Allocation transfer trends across the southern MDB in 2020-21 were generally consistent with historical trends. Vic 7 Murray (Barmah to SA) was the largest net exporter of water allocations, and SA Murray was the largest net importer of transfers. A key change in net trade was the volume transferred out of the Murrumbidgee; 303 GL is the largest volume ever reported by Ricardo, more than double the volume transferred out in 2019-20 (Table 2).
The analysis in Table 2 includes all water transfers, including those recorded on water registers at $0 and other non-commercial transactions (such as environmental transfers). While state governments have made new trade data available in 2020-21, such as recording the purpose of allocation trades on state water registers, these data are not yet available for a full water year. Ricardo will work on integrating these data into future net trade analyses, but for this year’s report we estimate commercial water allocation trade activity by simply excluding $0 transfers (Table 3).
The 2020-21 net change in priced allocation trade for Vic 1A Greater Goulburn was 68 GL. This reflects two dynamics. First, there were few opportunities for downstream trade before peak irrigation season. In 2020-21, only 92 GL was traded out of the Goulburn, the smallest volume since the trade rule was introduced. Second, large volumes of unused water meant market participants were looking for carryover space. This created a lot of back trade into the Goulburn in June, resulting in the largest IVT balance since 2014-15. In 2015-16 and 2016-17, Vic 1A Greater Goulburn was also a net importer of priced allocation transfers. This changed in 2017-18 and 2018-19 when high downstream trade volumes contributed to Vic 1A Greater Goulburn becoming a net exporter.
Table 2. Allocation transfer numbers and volumes, major southern Murray-Darling Basin trading zones (all reported trades and transfers) 2020-21.
|
Trading Zone
|
Within
|
Into
|
Out of
|
Net Change (ML)
|
|||||||||
|---|---|---|---|---|---|---|---|---|---|---|---|---|---|
|
Vic 1A Greater Goulburn
|
4,760
|
720,250
|
1,357
|
224,221
|
895
|
174,113
|
50,109
|
||||||
|
Vic 6 Murray (Dart to Barmah)
|
1,270
|
325,028
|
331
|
72,527
|
544
|
137,531
|
-65,005
|
||||||
|
Vic 7 Murray (Barmah to SA)
|
4,669
|
640,733
|
1,961
|
418,993
|
1,313
|
812,118
|
-393,125
|
||||||
|
NSW Murray
|
1,776
|
474,679
|
794
|
459,942
|
1,112
|
316,762
|
143,179
|
||||||
|
NSW Murrumbidgee
|
2,004
|
961,925
|
45
|
20,013
|
314
|
323,131
|
-303,118
|
||||||
|
SA Murray
|
881
|
325,094
|
563
|
685,653
|
510
|
93,888
|
591,765
|
||||||
|
Total
|
15,360
|
3,447,709
|
5,051
|
1,881,347
|
4,688
|
1,857,542
|
|||||||
Table 3. Allocation transfer numbers, major southern Murray-Darling Basin trading zones (excluding $0 transfers) 2020-21.
|
Trading zone
|
Within
|
Into
|
Out of
|
Net change (ML)
|
|||||||||
|---|---|---|---|---|---|---|---|---|---|---|---|---|---|
|
Vic 1A Greater Goulburn
|
3,443
|
290,147
|
1,036
|
120,245
|
586
|
53,245
|
67,900
|
||||||
|
Vic 6 Murray (Dart to Barmah)
|
905
|
97,186
|
231
|
33,034
|
285
|
46,661
|
-13,627
|
||||||
|
Vic 7 Murray (Barmah to SA)
|
3,267
|
318,589
|
1,309
|
209,086
|
856
|
106,339
|
102,747
|
||||||
|
NSW Murray
|
1,111
|
161,478
|
421
|
72,956
|
853
|
189,610
|
-116,654
|
||||||
|
NSW Murrumbidgee
|
1,366
|
355,428
|
25
|
10,349
|
91
|
19,688
|
-9,338
|
||||||
|
SA Murray
|
438
|
63,446
|
318
|
40,791
|
450
|
66,461
|
-25,670
|
||||||
|
Total
|
10,530
|
1,286,275
|
3,340
|
486,461
|
3,121
|
481,102
|
|||||||
3.4 Comparison of allocation market activity
General security allocations drive allocation market activity.
Much improved allocations to general security entitlements influenced allocation transfer and trade activity in 2020-21. Between 2019-20 and 2020-21, the annual volume of allocations transferred or traded increased by:
- 337 per cent in the NSW Murray (above Barmah), an additional 272 GL.
- 163 per cent in the NSW Murrumbidgee, an additional 608 GL.
- 64 per cent in the NSW Murray (below Barmah), an additional 227 GL.
In Victoria and South Australia, between 2019-20 and 2020-21, the annual volume of allocations transferred or traded:
- increased by 55 per cent in Vic 6 Murray, an additional 141 GL.
- slightly increased in Vic 1A Greater Goulburn (7 per cent).
- slightly decreased in Vic 7 Murray and the SA Murray (12 and 15 per cent respectively).
Allocation markets were particularly active during the final quarter of the year. This reflects the way in which high volumes of carryover from 2019-20, improved water allocations in 2020-21, timely in-crop rainfall and water usage below budget for many permanent horticulturalists created large volumes of unused water at the end of the year. The last few weeks of the year saw allocation market activity pick up as market participants finalised carryover and balanced their water accounts.

Figure 12. Monthly volume weighted average prices, and transfer and trade volumes (within and into), major southern Murray-Darling Basin trading zones, 2019-20 to 2020-21.
Source: Ricardo, 2021. Based on Victorian, New South Wales, and South Australian water registers, 2021.
Volume-weighted average price ($/ML)
Green – Volume transferred or traded 2020-21(GL)
Blue – Volume transferred or traded 2019-20(GL)
3.5 Trade constraints
Trade constraints continued to drive price divergences.
Trade constraints limit the trade and transfer of water allocations between major southern MDB markets. When binding, these constraints alter the within region water supply and demand dynamics.
Consistent with market dynamics in 2019-20, binding trade limits for most of the year created price differentials between upstream and downstream zones in 2020-21 (Figure 13). However, price differentials were not as extreme in absolute terms as those in 2019-20. This reflects increased allocations in all systems in 2020-21 compared to last water year.
The maximum price divergences based on weekly VWAPs were:
- Between the Murrumbidgee and lower Murray: $163 per ML (late September).
- Between the Goulburn and lower Murray: $135 per ML (mid-July).
- Between the upper Murray and lower Murray: $111 per ML (early August).
Downstream trade opportunities began to emerge from January 2021 in the Murrumbidgee, and slightly later in the upper Murray and Goulburn. This generally equalised prices across the southern MDB (Figure 13).
End-of-year downstream trade opportunities from the upper Murray and Goulburn were much larger in 2020-21 compared to 2019-20 (Figure 13). This demonstrates the large volumes of unused water that market participants accrued in 2020-21, much of which was back traded into the upstream zones to utilise carryover space.

Figure 13. Upstream to downstream trade opportunities (end-of-day), 1 June 2020 to 30 June 2021, with weekly allocation volume weighted average prices showing price divergence and equalisation.
Source: Ricardo, 2021. Based on Victorian and New South Wales water registers, 2021. MDBA 2021, Victorian Water Register 2021
3.6 Special topic: New purpose of allocation trade data
A key theme of multiple water markets inquiries and reviews over recent years has been the need to improve water market transparency.
In 2020-21, the NSW and Victorian governments started to report information about the purpose of allocation transfers and trades (from August 2020 in Victoria and from December 2020 in NSW). This is an important improvement to water market information so that commercial and non-commercial transfers and trades can be separated.
In this special topic, we present the purpose of allocation trade data that were recorded on the NSW and Victorian water registers in 2020-21.
Unsurprising, but important, insights into the purpose of allocation trade and transfer activity.
Figure 14 shows the monthly volume of trades or transfers by purpose, split into priced and $0 trades. Since December 2020:
- Standard commercial trades dominated priced (or commercial) trade activity (81 per cent).
- Related party transfers accounted for most of the $0 trades or transfers (83 per cent).
Consistent with the high demand to find and / or utilise carryover space at the end of 2020-21, 43 per cent of the volume of priced allocation trades in June 2021 recorded on the NSW and Victorian water registers was related to carryover parking.

Figure 14. Volume traded by purpose of trade in major southern MDB trading zones, 2020-21
Source: Ricardo, 2021. Based on Victorian and New South Wales water registers, 2021.
Note: Data includes trades and transfers into and within NSW Murray (above Barmah), NSW Murray (below Barmah), NSW Murrumbidgee, Vic 1A Greater Goulburn, Vic 6 Murray (Dart to Barmah) and Vic 7 Murray (Barmah to SA). Data excludes irrigation corporation trade and transfers.
Note: Victoria uses 8 categories and NSW uses 12 categories. All categories are reported.
3.7 Special topic: Allocation trade activity in the upper Murray
In previous years, Ricardo has received requests from market participants for insights on water market activity within NSW irrigation corporations.
Data on water market trade activity in irrigation corporations is important to build a more complete picture of allocation trade activity than can be done with state water register data alone.
Murray Irrigation Limited provide aggregated daily water allocation sales data on its website. In this special topic, we combine these data with data from the NSW and Victorian water registers to show what happened in the upper Murray in 2020-21.
Upper Murray end of season allocation trade driven by demand for carryover space.
Monthly allocation trade and transfer volumes generally increased through 2020-21, in line with increasing allocations to NSW Murray GS entitlements, reaching 50% in February 2021 (Figure 15).
Trade activity was particularly high in June 2021. This likely reflects demand for carryover space in the upper Murray. This is supported by 108 GL of back trade through the Barmah Choke in June 2021. The Barmah Choke balance reached almost 139 GL on the 30 June 2021, compared to 38 GL on the 30 June 2020 (MDBA, 2020, 2021).

Figure 15. Monthly allocation transfer and trade volumes, NSW and Victorian Murray (above Barmah) 2020-21
Source: Ricardo, 2021. Based on NSW and Victorian water registers. Murray Irrigation Limited website, 2021.
Note: Volumes from the NSW and Victorian water registers include all volumes transferred or traded (within and into zones 6 and 10).
4.0. Entitlement Markets
4.1. Entitlement trade prices
High reliability and high security entitlement prices started to soften.
After two years of double-digit increases, annual VWAPs for most high reliability and high security water entitlements decreased slightly in 2020-21. However, the decreases were relatively modest (single digit), and prices remain between 13 and 49 per cent higher than they were in 2018-19 (Table 4).
The lower annual VWAPs in 2020-21 largely reflect decreases in high reliability and high security entitlements that occurred in early 2020. Since July 2020, high reliability and high security entitlement prices have been comparatively stable. This stabilisation against a backdrop of wetter conditions, rapidly falling water allocation prices and lower returns, indicates a maturing of the market and the long-term expectations of market participants.
The exceptions were the VWAPs for Vic 7 Murray HRWS which increased 10 per cent during 2020-21, and NSW Murray HS (zones 10 and 11 combined) which remained largely unchanged.
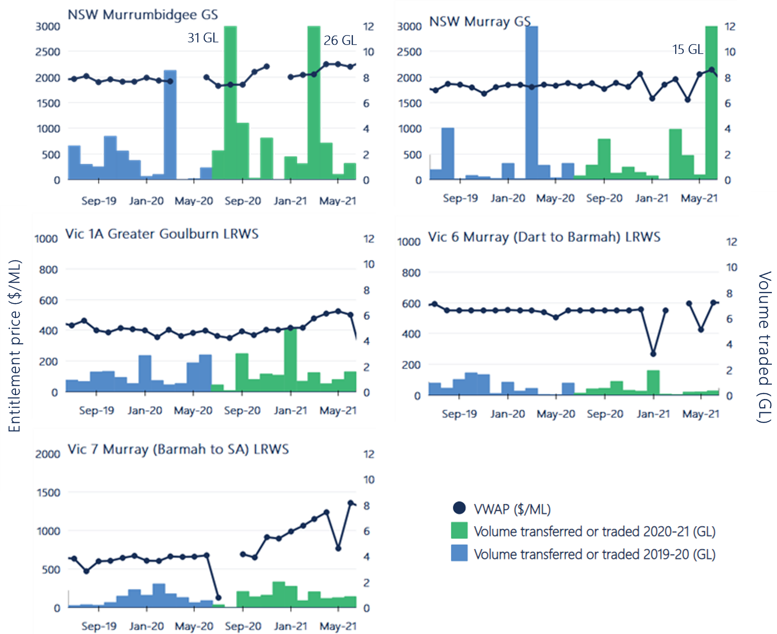
Prices for most low reliability and general security entitlements rebound.
After a dip in prices during 2019-20, most low reliability and general security entitlements increased slightly in 2020-21 (Table 4). The notable exception was Vic 7 Murray LRWS which increased to a record high of $928 per ML, as an annual VWAP. This is a 42 per cent increase from 2019-20 and demonstrates its attractiveness as a secure carryover product in the lower Murray. Market prices at the end of June 2021 were around $1,300 per ML.
Table 4. Annual transfer volumes and volume weighted average prices, major southern Murray-Darling Basin entitlements, 2019-20 and 2020-21.
|
Entitlement type
|
No. traded
|
Volume traded (ML)
|
Annual VWAP ($/ML)
|
Annual change in price (%)
|
Change in price 2018-19 to 2020-21 (%)
|
|||
|---|---|---|---|---|---|---|---|---|
|
Vic 1A Greater Goulburn HRWS
|
632
|
39,108
|
$4,485
|
$4,084
|
-9%
|
13%
|
||
|
Vic 1A Greater Goulburn LRWS
|
250
|
17,682
|
$399
|
$429
|
8%
|
-17%
|
||
|
Vic 6 Murray (Dart to Barmah) HRWS
|
130
|
13,315
|
$4,829
|
$4,466
|
-8%
|
17%
|
||
|
Vic 6 Murray (Dart to Barmah) LRWS
|
66
|
5,839
|
$555
|
$543
|
-2%
|
-3%
|
||
|
Vic 7 Murray (Barmah to SA) HRWS
|
623
|
28,858
|
$5,620
|
$6,157
|
10%
|
36%
|
||
|
Vic 7 Murray (Barmah to SA) LRWS
|
101
|
11,011
|
$653
|
$928
|
42%
|
50%
|
||
|
NSW Murray GS
|
70
|
28,301
|
$1,835
|
$1,870
|
2%
|
-5%
|
||
|
NSW Murray HS
|
35
|
6,663
|
$8,367
|
$8,386
|
0%
|
46%
|
||
|
NSW Murrumbidgee GS
|
41
|
74,282
|
$1,934
|
$2,029
|
5%
|
-5%
|
||
|
NSW Murrumbidgee HS
|
17
|
4,187
|
$7,484
|
$7,179
|
-4%
|
25%
|
||
|
SA Murray HS
|
131
|
9,712
|
$6,949
|
$6,815
|
-2%
|
49%
|
||
|
TOTAL
|
2,096
|
238,959
|
||||||
Note: NSW Murray HS and NSW Murray GS are a combination of entitlement trades in zones 10 and 11. The aggregation of these data reflect the way NSW Murray HS and GS trades are reported on the NSW Water Register.
- NSW Murrumbidgee HS decreased 2 per cent.
- NSW Murray HS decreased 3 per cent.
- SA Murray HS decreased 18 per cent.
- Vic 1A Greater Goulburn HRWS increased by 33 per cent. This was influenced by 15 GL of $0 trades in January 2021 (39 per cent of the annual volume).
- Vic 6 Murray HRWS increased by 4 per cent. This was influenced by 4 GL of $0 trades in January 2021 (30 per cent of the annual volume).

|
Entitlement type
|
Total entitlement on issue (ML)
|
Environmental held entitlements (ML)
|
VWAP ($/ML) 2020-21
|
Estimated value of entitlements on issue (million)
|
Estimated value of environmental entitlements (million)
|
|---|---|---|---|---|---|
|
Vic 1A Greater Goulburn HRWS
|
983,459
|
302,155
|
$4,084
|
$4,017
|
$1,234
|
|
Vic 1A Greater Goulburn LRWS
|
427,267
|
49,629
|
$429
|
$183
|
$21
|
|
Vic 6 Murray (Dart to Barmah) HRWS
|
320,450
|
117,289
|
$4,466
|
$1,431
|
$524
|
|
Vic 6 Murray (Dart to Barmah) LRWS
|
130,679
|
18,183
|
$543
|
$71
|
$10
|
|
Vic 7 Murray (Barmah to SA) HRWS
|
937,737
|
268,028
|
$6,157
|
$5,774
|
$1,650
|
|
Vic 7 Murray (Barmah to SA) LRWS
|
179,515
|
23,390
|
$928
|
$167
|
$22
|
|
NSW Murray 10 GS
|
1,301,236
|
364,760
|
$1,510
|
$1,965
|
$551
|
|
NSW Murray 10 HS
|
22,811
|
4,499
|
$7,000
|
$160
|
$31
|
|
NSW Murray 11 GS
|
372,860
|
119,913
|
$1,966
|
$733
|
$236
|
|
NSW Murray 11 HS
|
166,894
|
20,510
|
$8,120
|
$1,355
|
$167
|
|
NSW Murrumbidgee GS
|
1,891,995
|
478,391
|
$2,029
|
$3,838
|
$971
|
|
NSW Murrumbidgee HS
|
364,279
|
16,066
|
$7,179
|
$2,615
|
$115
|
|
SA Murray HS
|
608,000
|
205,000
|
$6,815
|
$4,144
|
$1,397
|
|
Total
|
7,707,181
|
1,987,811
|
$26,452
|
$6,929
|
Note: Volume weighted average prices were generated using data reported on the state-based water registers; market values my differ. The exceptions are NSW Murray 10 HS / GS and NSW Murray 11 HS / GS. Trades in zones 10 and 11 are not separated on the New South Wales Water Register, Ricardo used its in-house monthly fair market unit values averaged across 2020-21 to estimate the value of these markets.
Note: In reports prior to 2019-20, Ricardo reported the estimated value of environmental holdings based on Commonwealth environmental purchases only. For the last two years, Ricardo has used an estimate of the environmental entitlement on issue for major entitlements in the southern MDB. See Table Notes section for further details about data sources.
- The volume of NSW Murrumbidgee GS traded or transferred was 52 GL higher than in 2019-20.
- The volume of Vic 7 Murray HRWS traded or transferred was 77 GL lower than 2019-20. This decrease primarily reflects a single large trade associated with a corporate transaction in 2019-20.
|
Entitlement type
|
No. traded
|
Volume traded (ML)
|
Estimated turnover value (million)
|
Estimated turnover (%)
|
Average annual gross return (%)
|
|---|---|---|---|---|---|
|
Vic 1A Greater Goulburn HRWS
|
632
|
39,108
|
$160
|
6%
|
3%
|
|
Vic 1A Greater Goulburn LRWS
|
250
|
17,682
|
$8
|
5%
|
No allocation
|
|
Vic 6 Murray (Dart to Barmah) HRWS
|
130
|
13,315
|
$59
|
7%
|
3%
|
|
Vic 6 Murray (Dart to Barmah) LRWS
|
66
|
5,839
|
$3
|
5%
|
No allocation
|
|
Vic 7 Murray (Barmah to SA) HRWS
|
623
|
28,858
|
$178
|
4%
|
3%
|
|
Vic 7 Murray (Barmah to SA) LRWS
|
101
|
11,011
|
$10
|
7%
|
No allocation
|
|
NSW Murray GS
|
70
|
28,301
|
$53
|
2%
|
4%
|
|
NSW Murray HS
|
35
|
6,663
|
$56
|
4%
|
2%
|
|
NSW Murrumbidgee GS
|
41
|
74,282
|
$151
|
5%
|
5%
|
|
NSW Murrumbidgee HS
|
17
|
4,187
|
$30
|
1%
|
1%
|
|
SA Murray HS
|
131
|
9,712
|
$66
|
2%
|
3%
|
|
Total
|
2,096
|
238,959
|
$774
|
4%
|
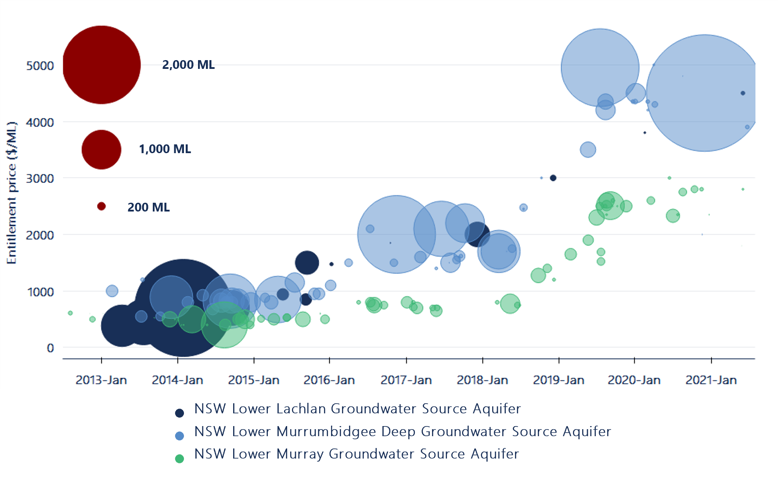
- Lower Lachlan Groundwater increased by 18 per cent, from $3,800 per ML to $4,500 per ML.
- Lower Murray Groundwater increased by 5 per cent, from $2,450 per ML to $2,579 per ML.
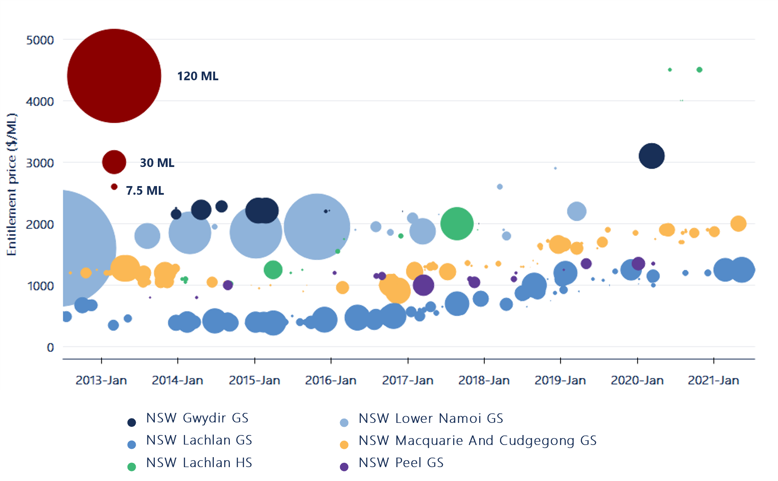
- NSW Lachlan GS increased 82 per cent from $671 per ML to $1,220 per ML.
- NSW Macquarie and Cudgegong GS increased 55 per cent from $1,258 per ML to $1,955 per ML.
- NSW Gwydir GS increased 89 per cent from $2,000 per ML to $3,782 per ML.
- Victoria revamped their online water accounts platforms, and released data on ownership of high reliability water shares for the first time.
- NSW has been reviewing online water information platforms to ensure they are fit-for-purpose for water users and consulting with stakeholders on long-term, state-wide and catchment water strategies to guide water policy and management over the next 20 years
- South Australia has started consultation on the state’s draft Water Security Statement. Earlier in the year, the South Australian Government reviewed their River Murray water allocation announcement information and process. They implemented the recommendations in their pre-season 2021-22 water allocation statements.
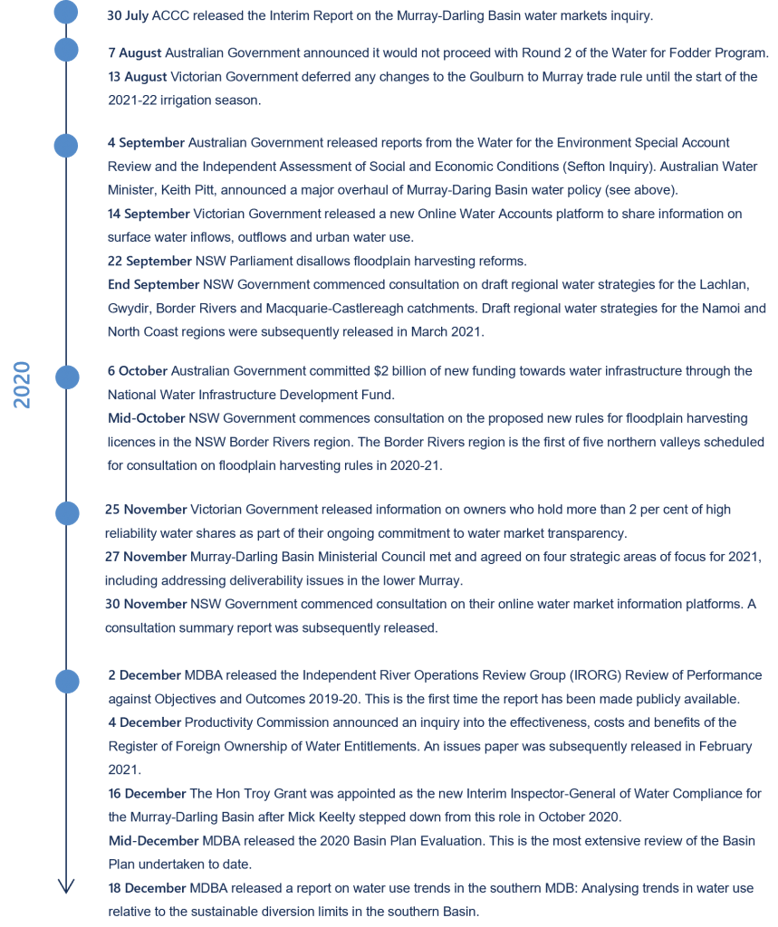
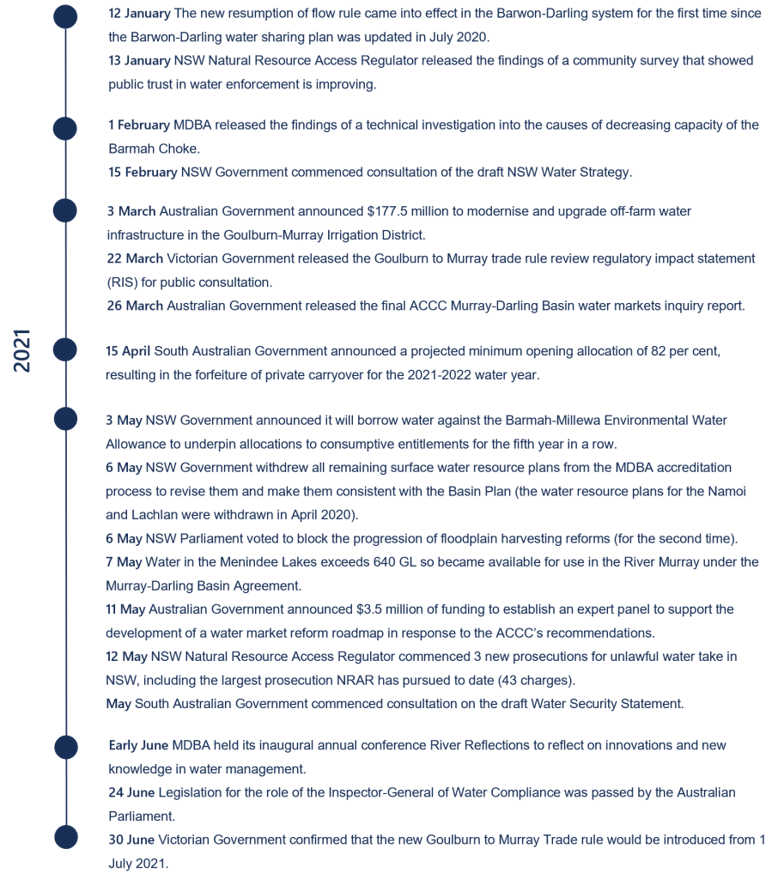
- Minister Pitt’s overhaul of MDB policy mentioned above.
- The release of the NSW Independent Commission Against Corruption’s Investigation into complaints of corruption in the management of water in NSW and systemic non-compliance with the Water Management Act 2000.
- MDBA publishing the Independent River Operations Review Group Review of performance against Objectives and Outcomes 2019–20 for the first time.
- The NSW Natural Resources Access Regulator pursuing new prosecutions for unlawful water take. In January 2021, NRAR released results that showed that public confidence in compliance actions appears to be slowly increasing.
- the Basin Communities Investment Package.
- implementing the Basin Plan.
- water market reforms as recommended by the ACCC Inquiry.
- deliverability in the River Murray system.
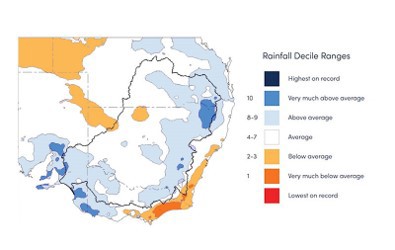
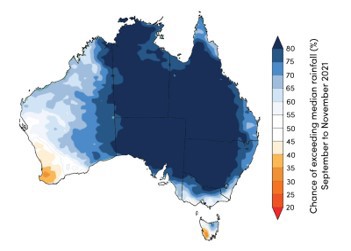
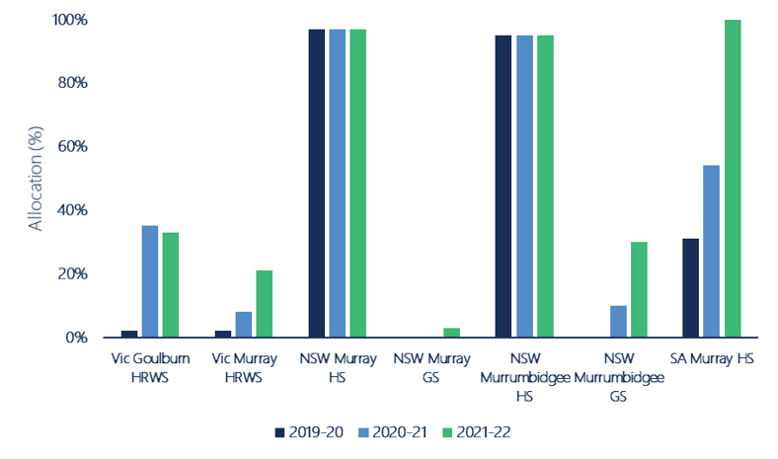
- NSW Murray GS opened at 3 per cent, the first non-zero opening in four years.
- SA Murray HS opened at 100 per cent for the first time in three years.
- NSW Murrumbidgee GS opened at 30 per cent, the highest opening allocation since 2012-13.
|
Wet - See note
|
Average - 50 per cent change of exceeding
|
Dry - 90 per cent change of exceeding
|
Extreme Dry - 90 per cent change of exceeding
|
Est. of consumptive water available (GL) - Average inflows
|
|
|---|---|---|---|---|---|
|
Vic 1A Goulburn HRWS
|
100%
|
100%
|
64%
|
41%
|
644
|
|
Vic 6 Murray HRWS
|
100%
|
79%
|
55%
|
33%
|
158
|
|
Vic 7 Murray HRWS
|
100%
|
79%
|
55%
|
33%
|
520
|
|
NSW Murray 10 HS
|
97%
|
97%
|
97%
|
97%
|
18
|
|
NSW Murray 10 GS
|
38%
|
22%
|
10%
|
356
|
|
|
NSW Murray 11 HS
|
97%
|
97%
|
97%
|
97%
|
142
|
|
NSW Murray 11 GS
|
38%
|
22%
|
10%
|
96
|
|
|
NSW Murrumbidgee HS
|
95%
|
95%
|
95%
|
95%
|
331
|
|
NSW Murrumbidgee GS
|
61%
|
50%
|
50%
|
862
|
|
|
SA Murray HS
|
100%
|
100%
|
100%
|
100%
|
403
|
|
Total
|
3,531
|
Note: Wet scenario not available for NSW general security entitlements. NSW Murray HS, NSW Murrumbidgee HS and SA Murray HS all received full allocations on 1 July 2021, so the full allocation is shown for all scenarios.
Note: Outlook months used to estimate the volume of water allocated by peak irrigation season are November for NSW entitlements and December for Victorian entitlements.
- Announcements about the next steps to establish an expert panel to develop a roadmap for implementing the recommendations from the ACCC’s water markets inquiry.
- Basin state co-operation to manage development in the lower Murray. This is one of the Ministerial Council’s four strategic priorities.
- Outcome of the Productivity Commission’s Review of the Register of Foreign Ownership of Water Entitlements.
- How and when the NSW Government updates its Water Resource Plans that were withdrawn from the MDBA accreditation process in early 2021.
- The size and timing of downstream trade opportunities from the Goulburn to the Murray with the new regime in place to transition to the new trade rule.
- Price divergences between upstream and downstream zones.
- Risk-based decision-making about which zones in which to carryover water.
Please see the PDF copy for full notes section.
- Data sources
- State water register trade data and volume weighted average prices
- Data cleaning method
- Irrigation corporation trade data
- Carryover estimates
- Entitlement on issue data
- Rounding errors
- Ricardo Entitlement Index
- Table Notes
- Figure Notes


