Follow Ricardo plc for regular updates
50+ years of the NAEI – evolution shaped by policy
08 Jun 2023
SHARE


The quality of the air we breathe matters a great deal. Air quality affects not just human health, but ecosystem health, and even the quality of the built environment. Picture the visibly smoke-stained Victorian buildings in the UK’s older cities. This staining is a direct effect of poor air quality, in this case, because of big releases of black smoke and particulate matter from coal burning and other combustion activities. These pollutants were the cause of the London smogs in the 1950s, which could have resulted in as many as approximately 12,000 excess deaths. And some readers may remember that back in the mid-1970s, ground level ozone concentrations in the countryside were so high they damaged crops. Due to the potential health risks of air pollution, the UK Government identified a need for an inventory of pollutants as far back as the early 1960s.
An inventory provides a way to estimate emissions that give rise to low level concentrations of pollutants in ambient air – the air you and I breathe.
What’s in a name?
The National Atmospheric Emissions Inventory, also known as the NAEI, contains estimates of emissions in the UK of a very wide range of air quality pollutants and all internationally reportable greenhouse gases (GHGs). It contains emissions at a wide range of spatial scales: national, regional, local authority; 1 km2, and even for individual road links and point sources. It’s all in there, and publicly accessible. If you’re curious, you can access it here.
This blog sets out some of the key moments in the UK’s air pollution history, and the key role the NAEI has played in helping to shape and inform what we understand about ambient air pollution over the years and its impacts on Government policy.
In the beginning…
It’s not clear when the NAEI was first officially created. It also didn’t start off being called the NAEI, and there have been many changes of institutional owners and the management team along the way. At least three current Ricardo staff members have been working as part of the core NAEI team for more than 20 years, bringing the combined experience of Ricardo’s legacy team to a staggering 403 years! This is a huge help with institutional memory.
It is believed that the first UK emission estimates for smoke and sulphur dioxide (SO2) were compiled by Mary-Louise Craxton (Weatherly) in the early 1960s. Mary-Louise worked at Warren Spring Laboratory and retired in 1983, making the NAEI at least 55 years old. During Mary-Louise’s time, there were only two air quality pollutants in the inventory, and although we don’t have the records anymore, it is likely that at most it would contain tens or hundreds of numbers, and it would have been calculated by hand and stored and documented on paper.
How much data is stored?
Starting from just two pollutants and a few hundred data points in 1960, by 1999 the NAEI had grown to accommodate 47 air quality pollutants and 6 GHGs in more than 100,000 data points. Today, the Inventory Agency collates over 30 million pieces of data on 59 air pollutants, 700 speciated Volatile Organic Compounds and 23 GHGs, all of which needs to be checked, stored securely, and archived safely by the inventory delivery team.
As a quick snapshot, the inventory now covers air quality pollutants, GHGs, Persistent Organic Pollutants (POPs), Hazardous Air Pollutants (HAPs), metals, metal species, acidifying species, eutrophying species, Non-methane volatile organic compounds (NMVOCs) and their species. The list is long, and ever expanding.
In the NAEI, the unique identifier for emissions occurring in a given year as a result of a certain process is a source-activity-pollutant combination; where:
- Source is the origin from which pollutants are emitted, e.g. driving cars, crop production etc
- Activity is the action carried out to emit pollutants, e.g. petrol consumed, fertiliser applied etc
- Pollutant is the specific pollutant emitted to air, e.g. CO2, NOX
Below we have extracted the number of unique source-activity-pollutant combinations in the inventory for the NAEI 1999 inventory and the most recent eight inventories to show how the NAEI has grown in detail over time.
[Click to view fullsize image]

NAEI timeline – evolution in progress
The graphic below shows the evolution of the NAEI over 7 decades. We have added a summary of the methodological guidance and guidelines that have been used to develop the NAEI methodologies, and provided a very brief summary of some of the major developmental milestones. Most notably this includes major updates in storage and capacity, a broadening of pollutants monitored, as well as official reporting guidelines published underpinned by inventory data. Guidance documents like the IPCC 2019 Refinement and EMEP/EEA 2023 have a direct influence on UK Government policy, often informing development of national air quality strategy.
Figure 1. Evolution of the NAEI – some major events
[Click to view fullsize image]

The big and the small
To be useful in understanding emissions and predicting future pollution levels, the inventory needs to be complete. As such, Ricardo’s inventory team includes estimates for all sources where there are data and methods available; from the biggest power station to scented candles. As times have changed, so too have the relative importance of emissions sources. The vast majority of pollutants estimated within the NAEI have seen dramatic decreases since the start of the time series, thanks to the implementation of policies and legislation like the banning of lead in petrol.
In 1970, the largest single emissions value in the inventory was for carbon dioxide emissions from coal fired power stations. In 2021, it was carbon dioxide from domestic space heating, using natural gas. This reflects changes in the sources of pollution in the UK over time, corresponding with the transition of our economy from one centred around heavy industry to one dominated by the service sector.
There are several interesting sources of emissions that the inventory team make estimates for, some of which you may not expect. Some of the more unusual ones are shown below:
| Pollutant | Source |
| Ammonia (NH3) | Emissions from pets |
| Ammonia (NH3) | Emissions from nappies |
| Non-methane volatile organic compounds (NMVOC) | Hand sanitiser usage |
| Many, including Particulate Matter (PM) | Bonfire night |
| SF6 (an F-gas) | Particle accelerators |
Requests and queries – from routine to left-field
The NAEI team regularly respond to queries about emissions from a wide range of people. These include government departments – perhaps to respond to parliamentary questions – through to the general public. All queries and responses are logged for future reference. The majority of queries are routine, such as providing ‘the sectoral split in GHG emissions as a time series from 2000 to 2021’.
But every now and then, the team carries out some more unusual investigations, including, many years ago, analysis of the mercury emissions from children’s toy cap guns. Caps were purchased by the team from a local newsagent and the powder in each cap was analysed in our laboratory. From publicly available sales statistics and the data gathered directly on cap gun mercury content, the team were able to estimate the UK mercury emissions from the unusual source. (Don’t worry, children’s toys no longer contain mercury!)
Although seemingly random and somewhat insignificant, it is important that the team is able to carry out such requests. This is especially true for queries relating new pollutant types and/or sources, as the more data that can be added to the inventory, the more useful it becomes.
Technology snapshot
Back in the 1960s records were kept via pen and paper, and later succeeded by computers from the 1980s onwards. Now, modern computing and software has opened up huge new possibilities for data storage and computational analysis.
The technology used in the NAEI to both calculate and quality check emissions has greatly moved on, even in just the last 10 years. Nowadays, the NAEI ecosystem is comprised of a number of coded models and almost 100 ‘mastersheets’. Each mastersheet is a bespoke sector/fuel specific excel model used to calculate activity data and emission factors for the NAEI up to the latest historical year (at present 2021).
By querying the database from NAEI 2014 (the first year that a Structured Query Language (SQL) database was used as opposed to Microsoft Access) and from the most recent year (NAEI 2021), we can visualise how the software used to calculate data has evolved. This is displayed in the doughnut plot below.
In NAEI 2014, a vast proportion of the data compiled was done via Excel, with sectors such as road transport and power stations being compiled via MS Access. SQL was primarily used to generate emission factors for Particulate Matter (e.g. PM2.5) species and for emission factors for Overseas Territories and Crown Dependencies of the UK, such as Gibraltar. In the current NAEI ecosystem, a greater share of the annual inventory calculations are compiled using more complex systems rather than Excel e.g. emissions for the agriculture sector are compiled using a C# model, where as R software is used for shipping, road transport and residential combustion among other things. SQL is used for simple emission factors which are not time series dependent.

Making it all make sense
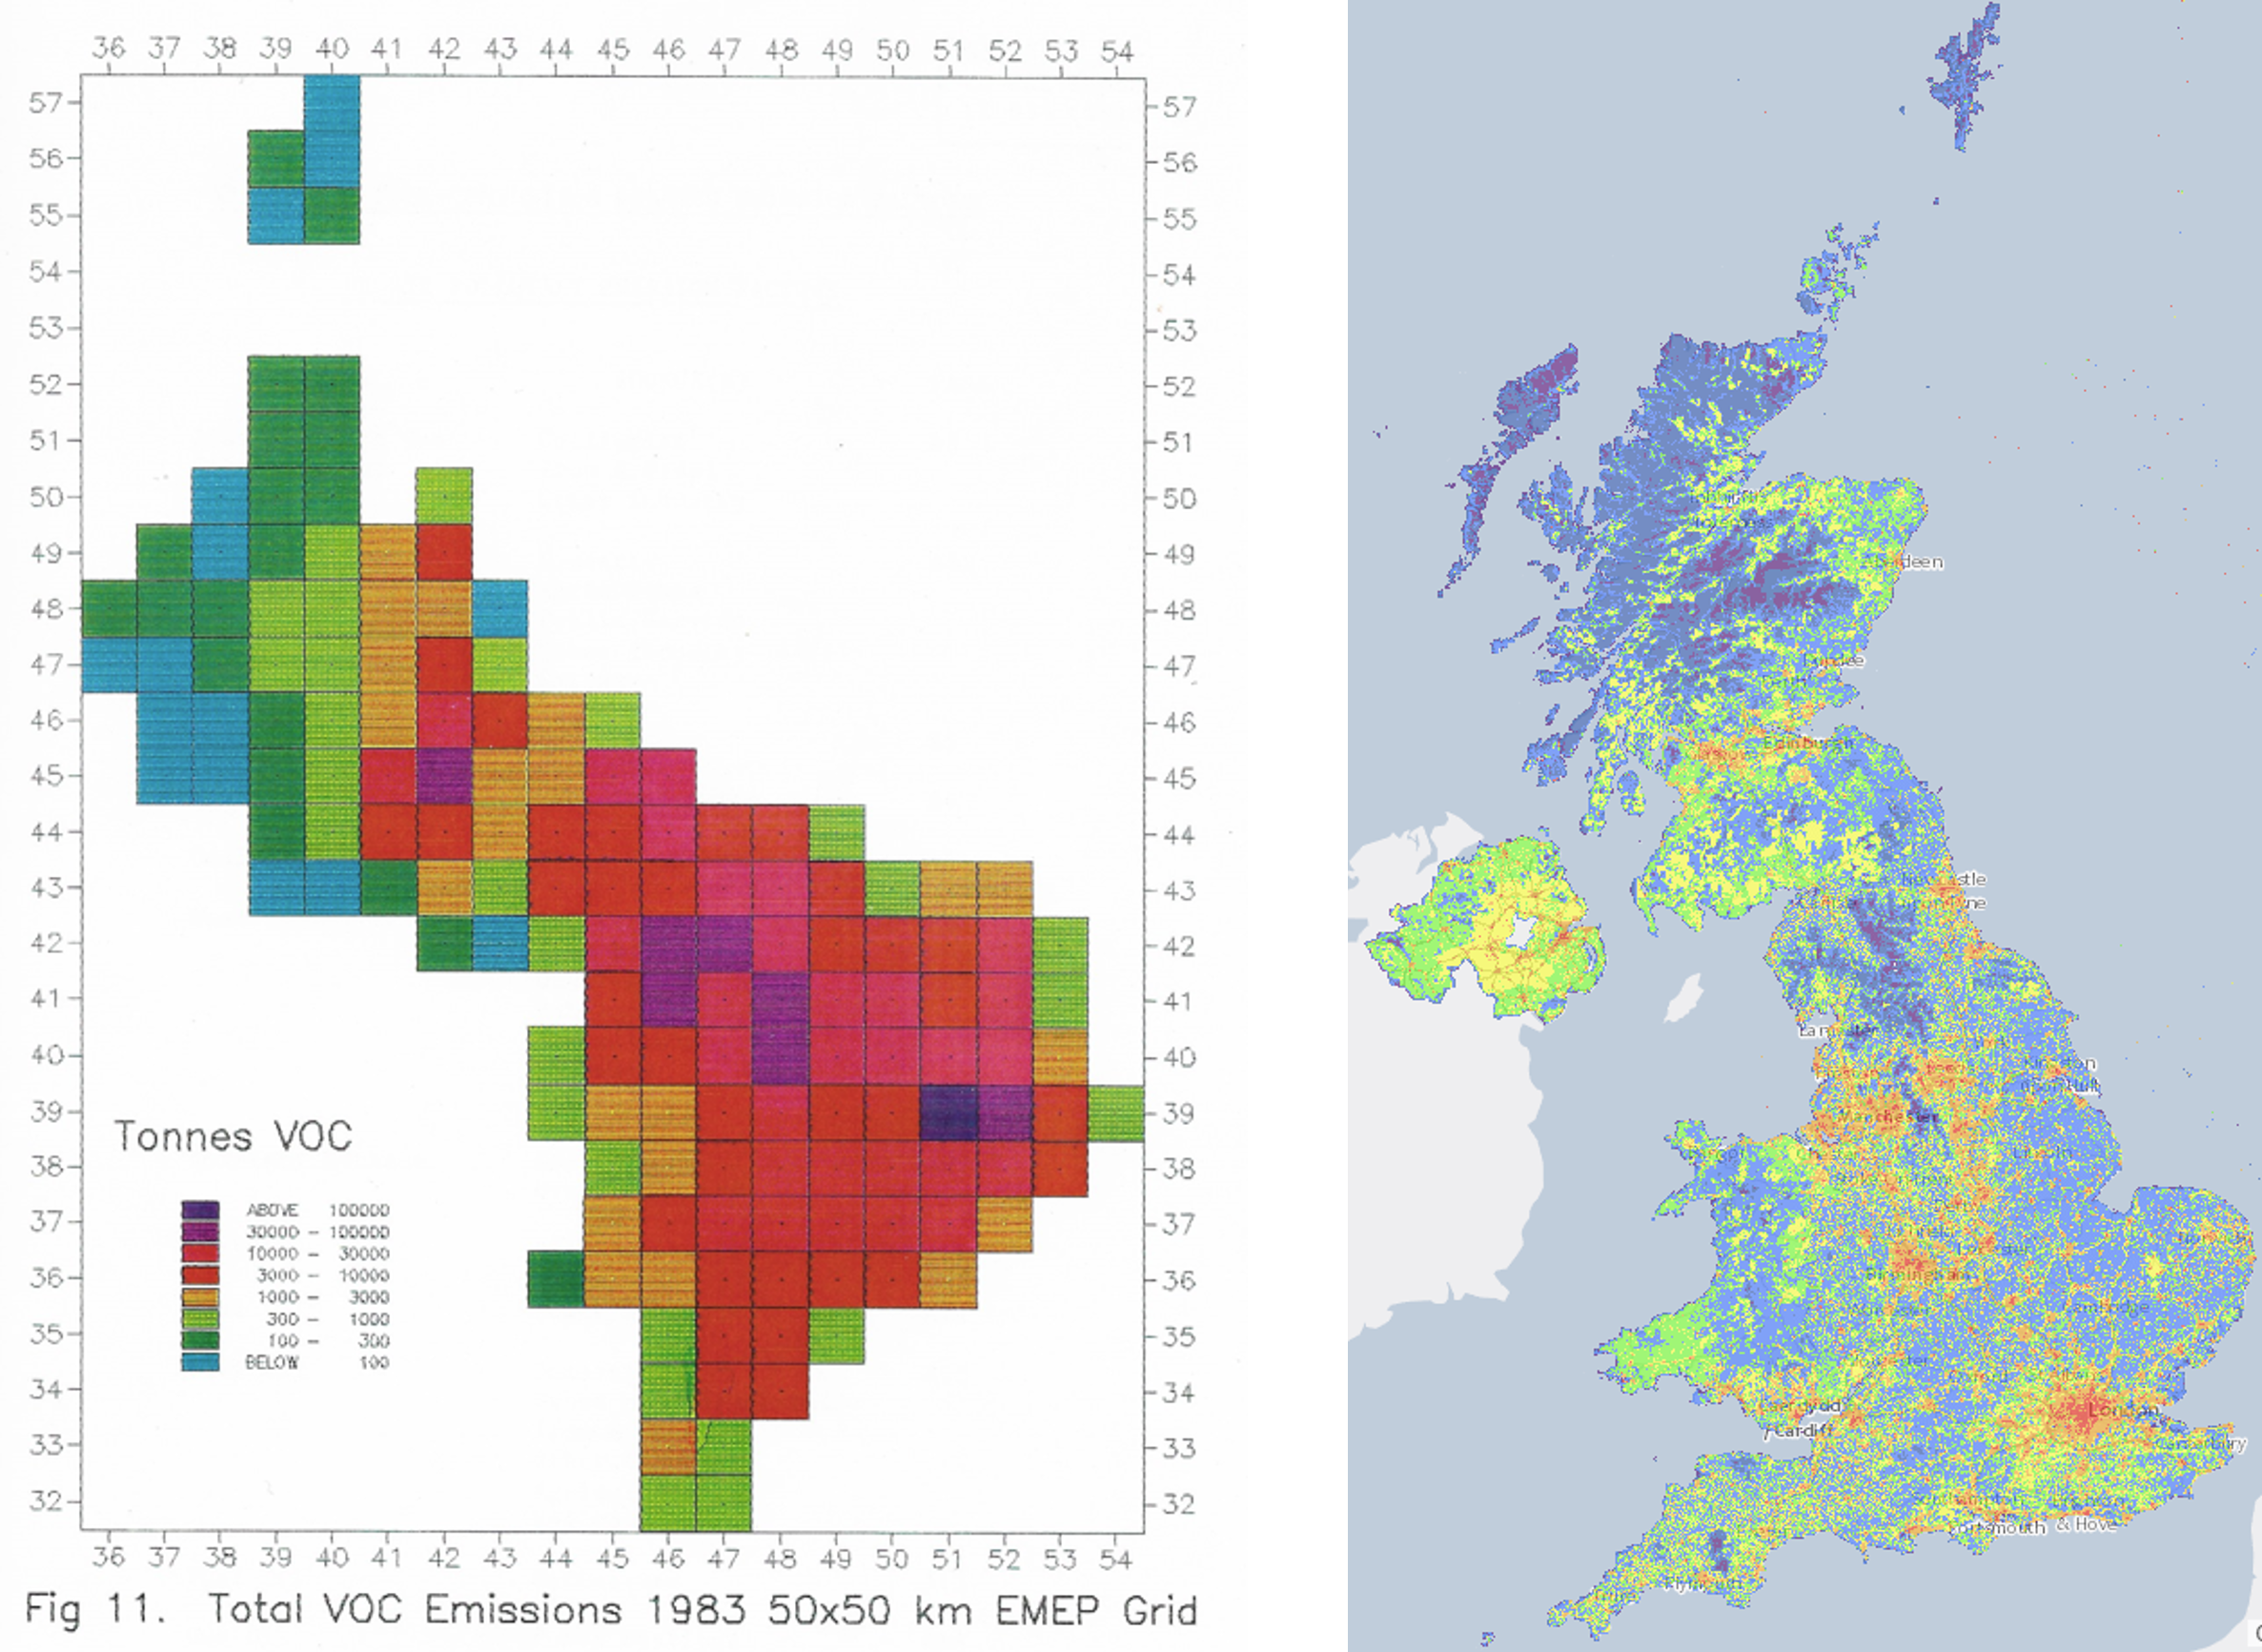
As part of the NAEI, Ricardo produce spatially disaggregated emission maps to help the modelling community understand inventory data. Both of the images below show the distribution of NMVOC emissions across the UK, the image on the left shows emissions on a 50x50 km grid from 1983 displayed via a colour dot matrix. On the right is the NMVOC map that we produce now – at a 1x1km grid level. It’s safe to say that things have moved on a lot since the dot matrices of the 1980s. However, it’s still possible to pick out cities at that level. If you look closely, you can see each of the offshore rigs in the North Sea individually. Emission maps like these are useful for local government and policy makers to understand the distribution of pollutant emissions across a region and identify pollution hotspots and areas that could benefit from mitigation action.
A steady evolution of function driven by policy needs
The NAEI has been overseen by a range of government departments over the years. Back in the 1990s, the Department of the Environment was responsible, followed by the Global Atmosphere division of Defra. The formation of the Department for Energy and Climate Change (DECC) saw split ownership of the NAEI between Defra and DECC, with the Department for Business, Energy and Industrial Strategy (BEIS) and now the Department for Energy Strategy and Net Zero (DESNZ) picking up the reins.
The organisations delivering the NAEI have been the predecessors of Ricardo: Ricardo Energy and Environment, AEA Energy and Environment, AEA Technology (netcen), and Warren Spring Laboratory, with support from a number of partners.
Despite the changes in department names and the mechanisms of government over the years, the function of the NAEI has always remained clear. It provides a reliable evidence base of emissions for all major sources of air pollution and greenhouse gases in the UK. Inventory data can be used by government for a wide range of purposes. These include to satisfy international and domestic data reporting requirements, and to formulate policy to help control and reduce public and ecosystem exposure to air quality pollution.
NAEI data and information is often used by a very wide range of stakeholders, informing various scientific research (toxicological studies, ecology, epidemiology etc), for air pollution and climate change modelling, academic and public studies, as well as for international reporting, policy making, national statistics and tracking progress of policies and measures intended to improve the quality of the air we breathe and minimise global warming. The list is extensive.
The future for the NAEI
The UK will always need an NAEI. Climate change is one of the largest risks to humanity, and every country in the world, including the UK, needs an accurate and complete GHG inventory. Air quality, although once such a visible problem, remains a key issue. No doubt in the future scientists will identify new pollutants of concern that are not yet monitored.
Thanks to rapid technological advancement, the NAEI is quickly evolving, encompassing new functionality that was not available previously. The rapid emergence of artificial intelligence provides new opportunities to improve data inputs, enhance quality control and the detection of new trends, correlations and features in data. New approaches to data visualisations and massive increases in GIS systems are allowing us to visualise and spatially analyse data in detail unimaginable 20 years ago.
The future possibilities of how the inventory could grow and develop further are almost endless. Ricardo’s team is proud to play a key role in the delivery of the NAEI, as it continues to be a vital evidence base for reporting, tracking and predicting emissions, in addition to providing valuable insight into opportunities to improve the quality of the atmosphere for all.

Further reading
NAEI website
Latest Greenhouse Gas Methodologies
Latest Air Pollutant Methodologies
Key articles underpinned by NAEI data
Chief Medical Officers Annual Report on Air Pollution
AQEG Initial Analysis on the COVID-19 Pandemic’s impact on emissions
UK Environmental Accounts
Conversion Factors for Company Reporting of GHG Emissions
Related insights