Play Video
Geodata analysis and visualisation
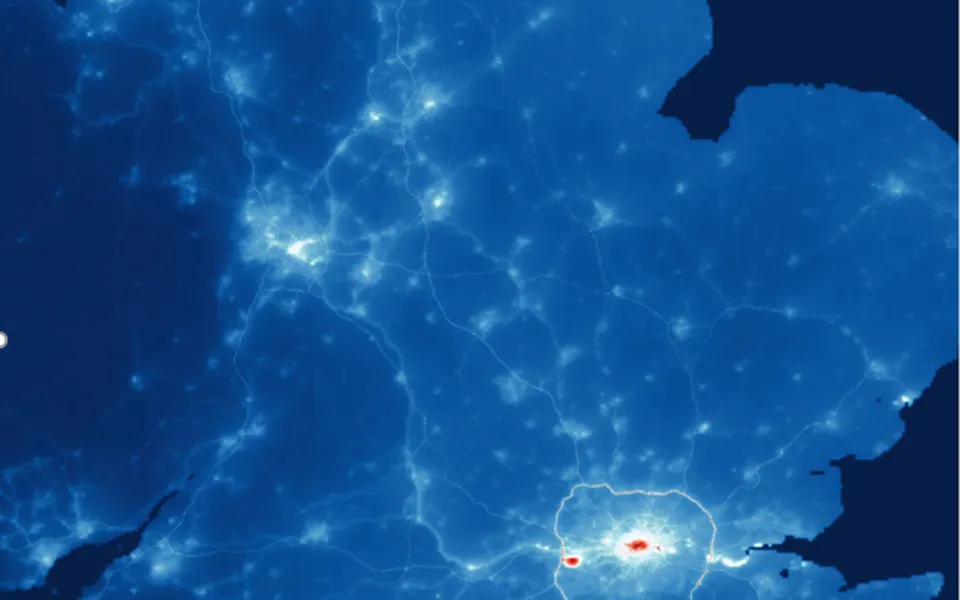
Understand your location-based data using innovative Geographical Information Systems (GIS) techniques to analyse, visualise and report data and information related to your area.
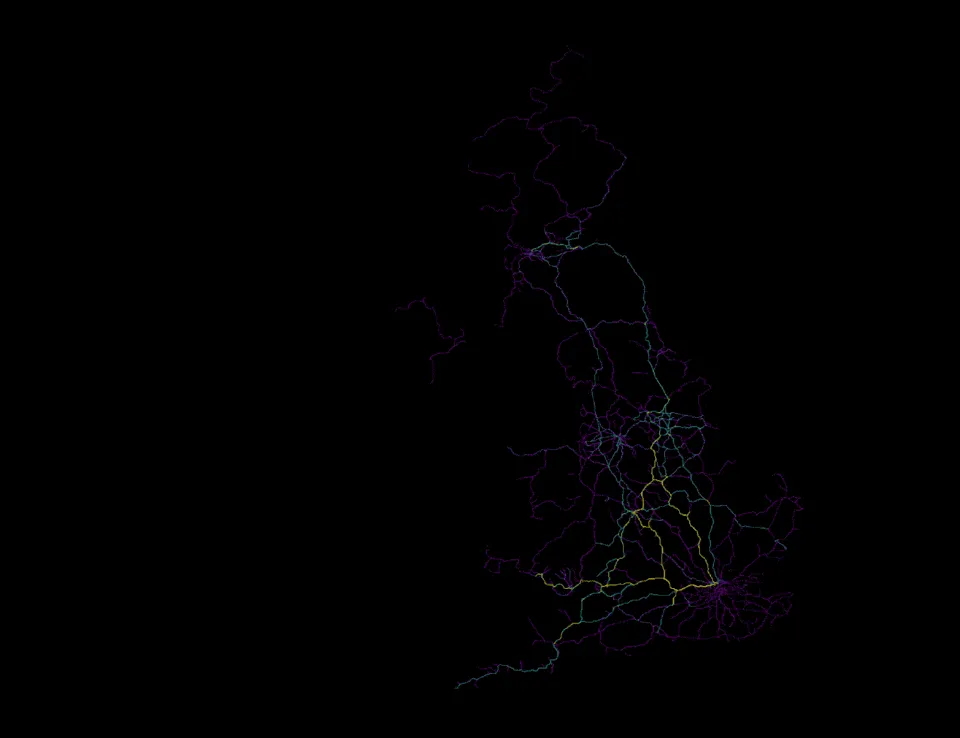
Watch your data come to life!
No matter how complex your data are, our experts are equipped with GIS, Data Science and Earth Observation skills to tackle the most pressing environmental issues and address crucial questions related to air quality, climate change and adaptation, energy, transport, water, land use, and waste management. We have a deep understanding of the requirements for effective analysis and have honed our skills through a variety of complex projects, with a proven track record of delivering high-quality results to national and international clients.
One-stop shop for all your geodata intelligence
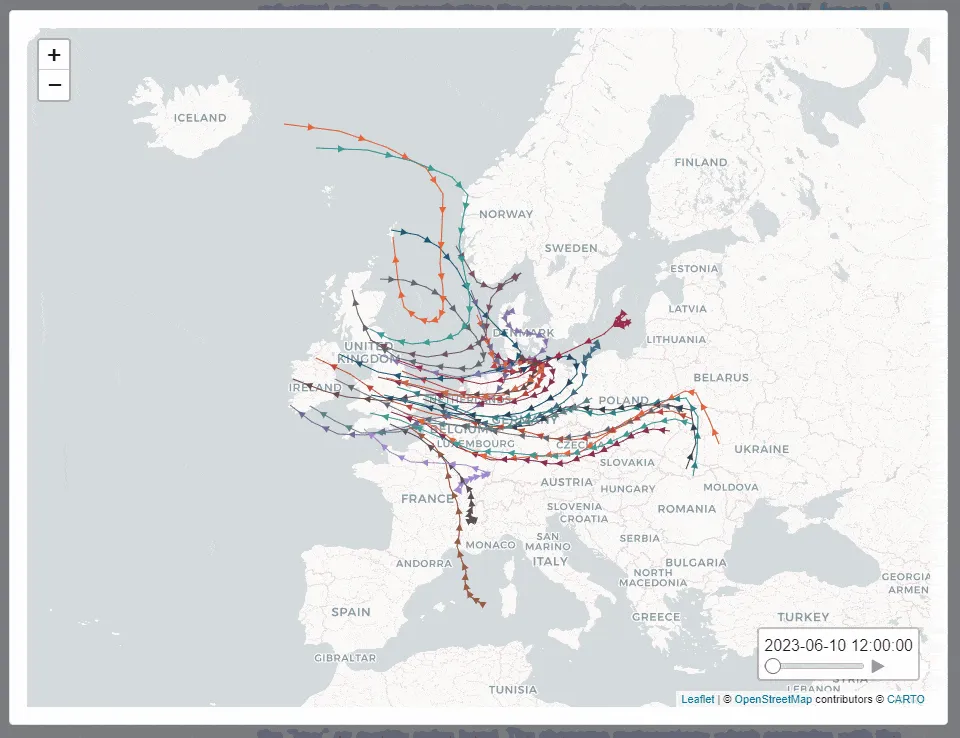
Dynamic reporting
We produce dynamic reports and dashboards that turn your tables, plots and graphs into an interactive and engaging data experience.
When working with us, you can take advantage of our large pool of experts in various environmental issues at Ricardo who can transform your complex data themes and findings into an engaged campaign and will help empower data users to make better-informed decisions. Our dynamic reporting capability can help you get enhanced insights from your data and ensure that these are best communicated to environmental practitioners and engaged members of the public alike.
Earth observation
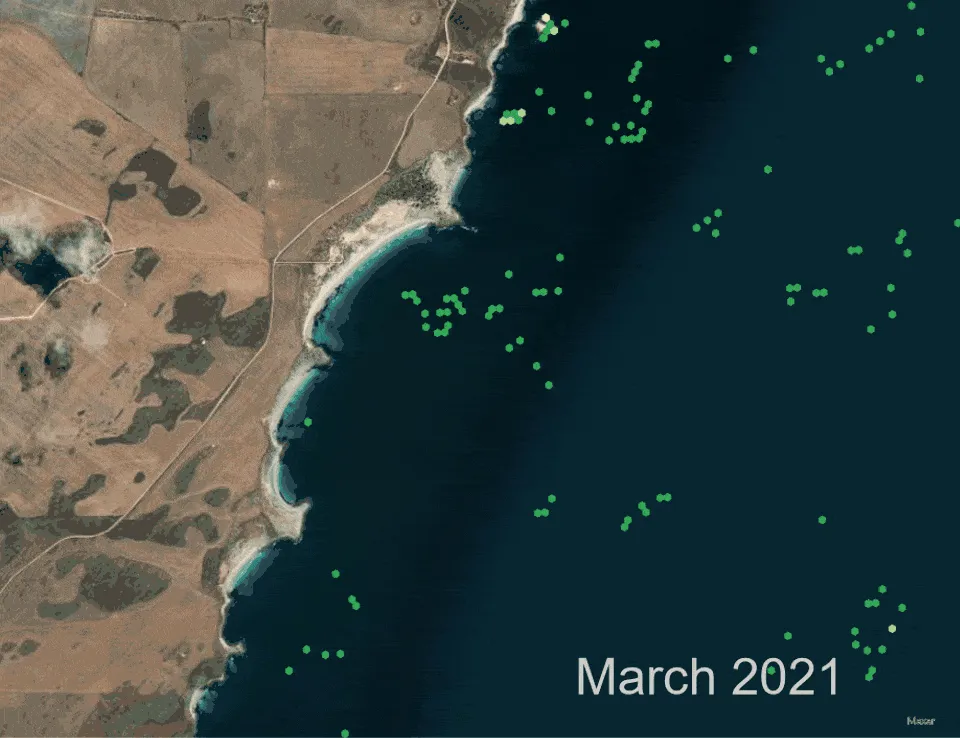
Our Earth Observation team takes you beyond the eye, transforming satellite imagery into clear, actionable insights.
With expertise in air quality forecasting, emission inventory verification, and land-cover assessments using multispectral imagery, we uncover hidden environmental patterns like algal bloom detection and post-fire revegetation dynamics. From developing protocols that integrate satellite data into regulatory frameworks to improving land-use change tracking for the UK’s Greenhouse Gas Inventory, we help you stay ahead of climate goals and meet regulatory requirements with confidence.

Bespoke interactive maps
Build the mapping application that fulfil your users’ needs.
The market is flooded with mapping tools and application, but which one is the right for you and your data? Our team have many years of experience on both proprietary and open-source solutions and can advise you on which ones are appropriate for you and your budget. We are serving a plethora of bespoke applications from our customers that are built for either general access to inform a large group of users or password protected for your team and organisation only.
Our strengths
Research & Development
At the core of our innovative work is a commitment to staying ahead with cutting-edge technologies and agile practices. Our experts continuously refine their skills through conferences, as well as extensive collaborations with leading research institutes and academic departments, ensuring we deliver the latest in technical advancements.
Modelling
Advanced modelling on your environmental data, working with you to apply different scenarios of how your data might influence people’s health or the environment depending on the mitigating measures that you are considering for implementation. We will guide you to the best cost-effective solution that will deliver you the highest benefits.
Health Services and apps
We deliver and manage reliable health alert services and apps for current and upcoming pollution events. We produce cost effective, proven data portals and information systems that are recognised as best in class.
Educational materials
We produce educational materials to ensure that young people can grow up with an understanding of air pollution and the difference that they can make. Our bespoke websites provide advice on air pollution health impacts, how to reduce pollutant emissions, and actions to be taken if high pollution concentrations are experienced - all with the help of children-friendly interactive user interfaces.
Why work with us
Save on staff resource and investment in new technologies and/or platforms, by working with an established provider with a proven track record in delivering reliable, accurate and insightful presentation of environmental data across a wide range of platforms.
Ricardo’s bespoke public information and alert services are modular in nature, making them easily configurable to client needs. Visual display information is constructed as specified and tailored to help you meet your public reporting goals and priorities.
Geodata analysis and visualisation Resources


