Save on staff resource and investment in new technologies and/or platforms, by working with an established provider with a proven track record in delivering reliable, accurate and insightful presentation of air quality data across a wide range of platforms.
Air data visualisation
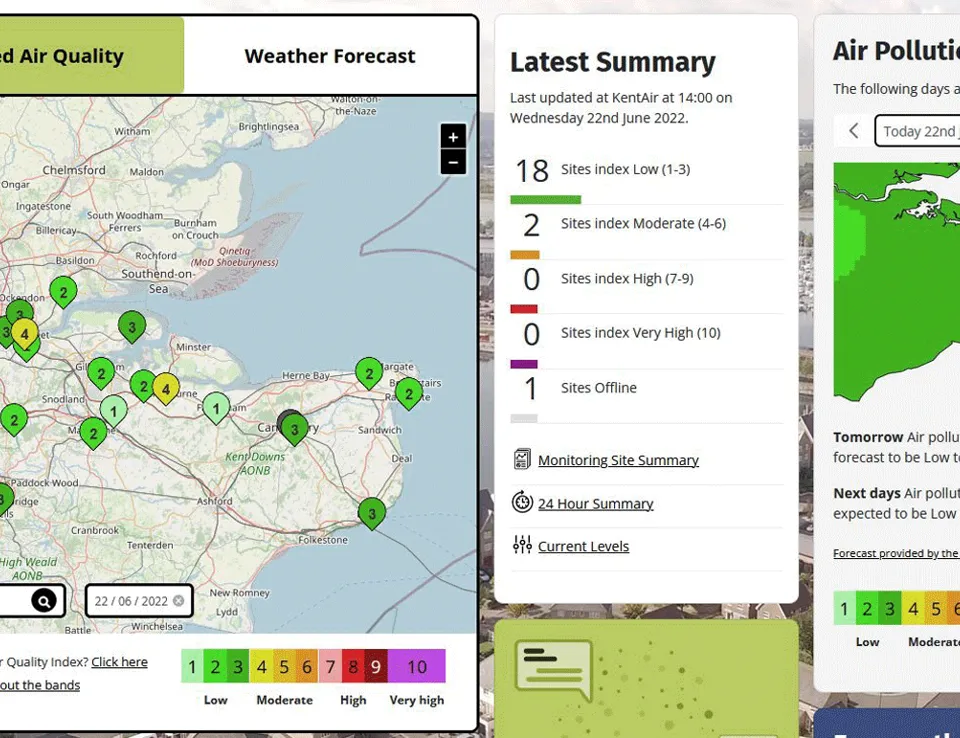
Utilising the latest data visualisation techniques we help you understand the influence of different sources on measured levels of air pollutants.
Achieve your public reporting goals and priorities
Ricardo can help you protect the health of local citizens and reduce costs associated with intervention measures by investing in early warning pollution information systems.
Solutions are tailored to your air quality data dissemination needs and will help empower members of the public to make better-informed decisions regarding their air pollution exposure.
Projects

Air quality support to the Scottish Government
Read case study
Designing a scenario-modelling tool to inform policy on air pollutant emissions
Read case study
Assessing road scheme impact on pollutant concentrations for Edinburgh Airport
Read case studyOur services include
We provide accurate, real time, open access, user friendly, air pollution visual data displays.
We have decades of experience in the successful delivery of bespoke, informative, public-facing air quality information websites all of which are fully modular and easily configurable to suit customer needs.
We deliver and manage reliable health alert services and apps for current and upcoming pollution events.
Alert services delivered by Ricardo include Air Quality Scotland’s “Know & Respond” app and the Hertfordshire and Bedfordshire Air Pollution Alert System.
We produce cost effective, proven data portals and information systems that are recognised as best in class. Here is how we supported the Hertfordshire and Bedfordshire local authorities in designing a free alert service, managed by Ricardo, to help those living and working in the region understand their exposure to air pollution and access advice on limiting risk.
We produce educational materials to ensure that young people can grow up with an understanding of air pollution and the difference that they can make. Our bespoke websites provide advice on air pollution health impacts, how to reduce pollutant emissions, and actions to be taken if high pollution concentrations are experienced - all with the help of children-friendly interactive user interfaces. See our examples here.
We manage data archives giving free access to hundreds of air quality datasets, including the UK and Scotland national air quality archives, as well as websites for local authorities and businesses such as Heathrow Airport.
We provide dynamic reporting utilising embedded data to enable easy data visualisation of air pollution information and enhanced user interactive tools (report tables, plots and graphs) that allow for greater data interrogation. A key example is this Automatic Urban and Rural Network (AURN) air quality episode report for bonfire night of 2022.
Educational packages
We have developed many fun and informative educational modules

Scottish Air Pollution Detectives
Helping children understand what is air pollution, climate change and how they can help on behalf of Air Quality in Scotland

Welsh Young Dragons
Helping the young Welsh children understand air pollution and how to tackle it as a Welsh Dragon on behalf of Air Quality in Wales

Northern Ireland Pollution Busters
Providing pollutant information and helping children understand air pollution in Northern Ireland on behalf of the Department of Agriculture, Environment and Rural Affairs
Why work with us

Cost effective service
Industry leading QA/QC
We provide industry leading QA/QC procedures designed to support the highest levels of data accuracy, maximising data capture and providing analytical insight from your monitoring stations.
Modular solutions
Ricardo’s bespoke public information and alert services are modular in nature, making them easily configurable to client needs. Visual display information is constructed as specified and tailored to help you meet your public reporting goals and priorities.
Powerful data management tools
Use of R and openair data analysis tools to produce insightful, interactive online reporting which includes display of dynamic data tables and graphs.
Air data visualisation Resources